1
Please refer to important disclosures at the end of this report
1
1
Particulars (` Cr)
Q3FY20
Q2FY20
% chg (qoq)
Q3FY19
% chg (yoy)
NII
8,545
8,057
6
6,875
24
Pre-prov. profit
7,549
6,874
10
6,146
23
PAT
4,146
655
533
1,605
158
Source: Company, Angel Research
For Q3FY2020, ICICI Bank reported PAT of `4,146cr, which was driven by 24%
yoy growth in NII and lower provisions. The key positive for the quarter was retail
loan growth, NIM improvement and GNPA decline led by Essar recovery. Further,
on the negative side slippages continued to remain elevated at `4,400cr due to
corporate accounts, coupled with retail slippages largely owing to Kisan credit
card and CV portfolios.
Recovery led to lower GNPA; BB & Below book marginally up: During the quarter,
slippages remained higher at `4,363cr, of which `1,890cr slipped from retail
book and `2,743cr slid from corporate book (Broking account & south India
based industrial company). GNPA/NPA ratios improved 42bps/180bps qoq to
6%/1.5% owing to Essar Steel resolution. Further, the addition to BB & Below
book disappointed (`17,403cr, 2.7% of loan) owing to downgrades in the
telecom sector. Management indicated that there could be moderate addition into
BB & Below book owing to subdued macro situation. Credit cost guidance after
considering recovery from IBC was in the range of 1.2-1.3% in Q2FY2020, which
has been increased to 1.5-1.7% or at similar run rate of 9MFY2020, owing to a
delay in resolution for some accounts.
Advances led by retail lending; NIM stable: The bank’s advances grew by 13%
yoy (4% qoq) aided by healthy retail loan book growth of 19% yoy. The main
drivers leading to the growth in the retail loan book were personal loans/credit
card lending, which grew by 51%/43% yoy. NIM stood at 3.77% against 3.64% in
Q2FY2020 and 3.22% in Q3FY2019 (included a 10bps impact from interest
reversals.). CASA ratio declined to 47% vs. 49.3% in Q3FY2019 as growth in
term deposits (35% yoy) outpaced that in CASA deposits.
Outlook & Valuation: At the current market price, the bank’s core banking
business (after adjusting the value of subsidiaries) is trading at 2.1x FY2021E
ABV. Key parameters to watch for the next few quarter are slippages from
corporate book and addition to BB & Below book. We recommend a HOLD on
the stock with a Target Price of `590.
Exhibit 1: Key Financials
Y/E March (` cr)
FY18
FY19
FY20E
FY21E
FY22E
NII
23,025
27,015
32,989
38,556
45,753
% chg
6
17
22
17
19
Net profit
6,645
3,362
10,043
17,469
21,884
% chg
(32.2)
(49.4)
199
74
25
NIM (%)
3.1
3.2
3.6
3.6
3.7
EPS (`)
10
5
16
27
34
P/E (x)
52
103
34
20
16
P/ABV (x)
4.2
3.5
3.2
2.8
2.5
RoA (%)
0.8
0.4
1.0
1.5
1.6
RoE (%)
6.5
3.1
8.9
14.0
15.6
Source: Company, Valuation done on closing price of 27/10/2019
HOLD
CMP `536
Target Price `590
Investment Period 12 Months
Stock Info
Sector
Bloomberg Code
Shareholding Pattern (%)
Promoters 0.0
MF / Banks / Indian Fls 34.4
FII / NRIs / OCBs 36.2
Indian Public / Others 8.4
Abs. (%) 3m 1yr 3yr
Sensex 4.9 13.5 47.6
ICICIBank 14.2 56.1 116.7
Beta
1.4
Banks
Market Cap (` cr)
3,47,008
52 Week High / Low
552/336
Avg. Daily Volume
11,20,862
Face Value (`)
2
BSE Sensex
41,155
Nifty
12,119
Reuters Code
ICBK.BO
ICICIBC IN
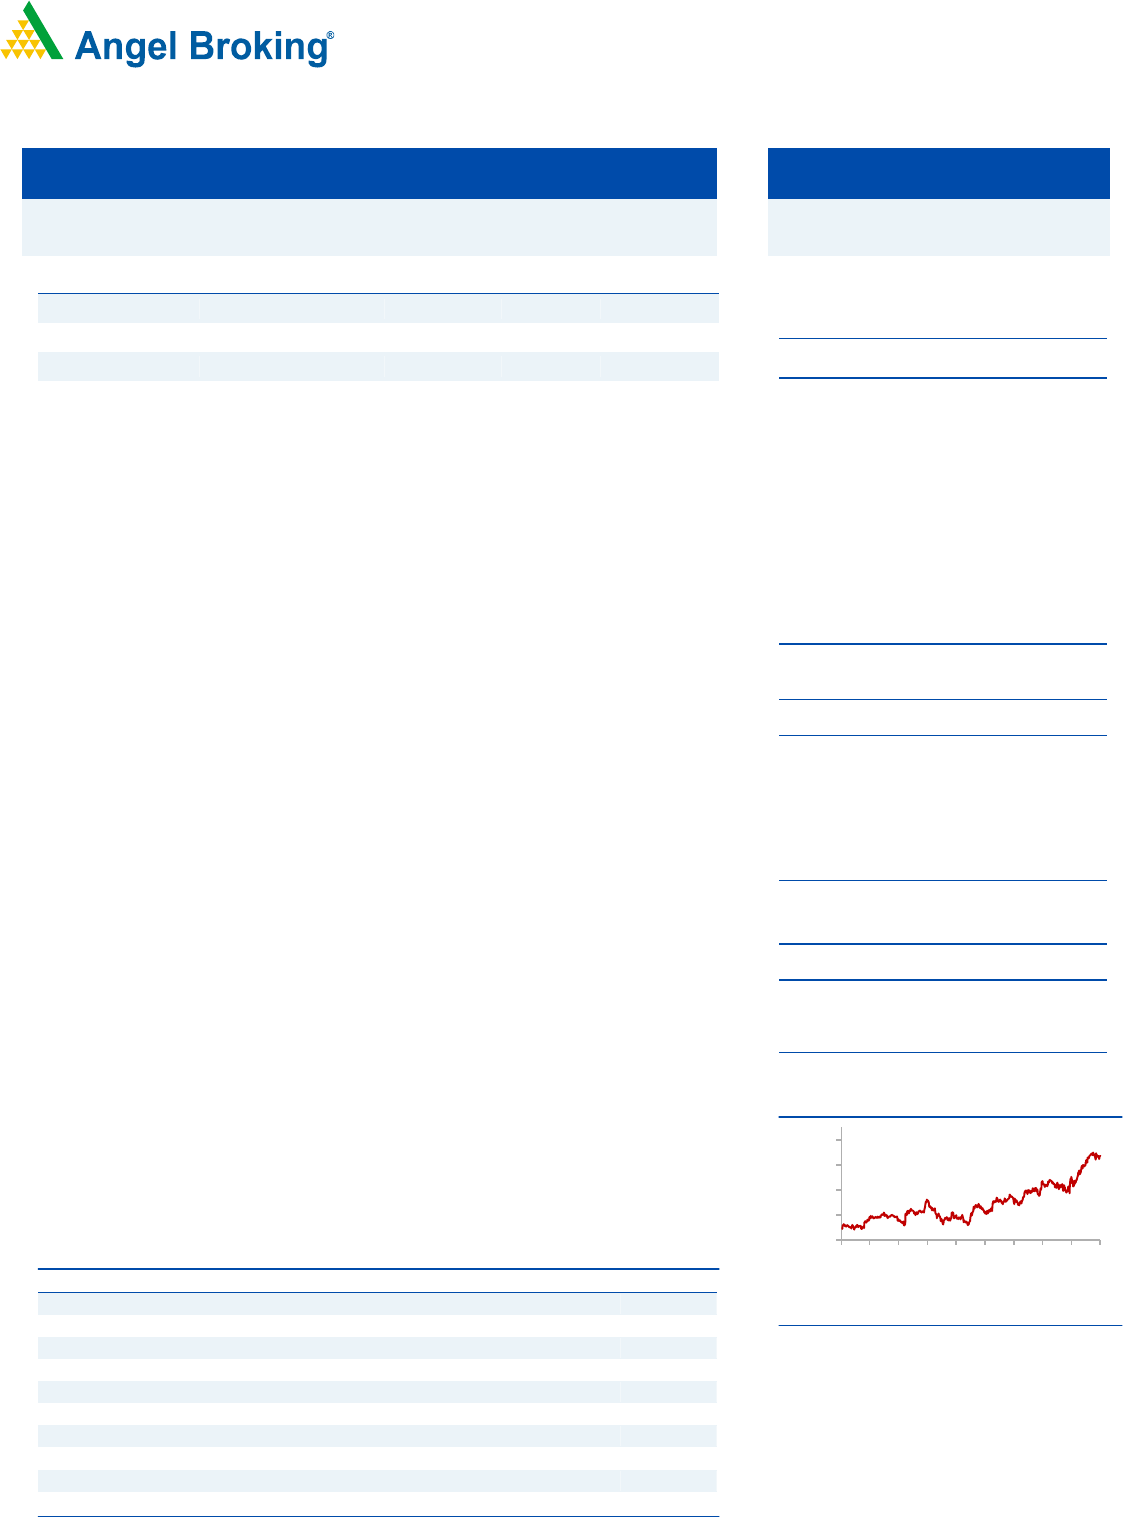
3-year price chart
Source: Company, Angel Research
200
300
400
500
600
Jan-17
May-17
Sep-17
Jan-18
May-18
Sep-18
Jan-19
May-19
Sep-19
Jan-20
ICICI Bank
Strong Operating Performance
Q3FY2020 Result Update | Banking
Jan 28, 2020
2
ICICI Bank|Q3FY2020 Result Update
Jan 28, 2020
2
Exhibit 1: Quarterly Performance
Particulars (` cr)
Q1FY19
Q2FY19
Q3FY19
Q4FY19
Q1FY20
Q2FY20
Q3FY20
% chg (qoq)
% chg (yoy)
Interest Earned
14,722
15,106
16,280
17,293
17,980
18,565
19,064
3
17
on Advances / Bills
10,982
11,512
12,524
12,925
13,616
14,304
14,796
3
18
on investments
3,136
3,086
3,237
3,338
3,645
3,726
3,679
(1)
14
on bal with RBI & others
227
147
135
227
147
136
184
35
37
on others
378
360
385
802
571
399
406
2
5
Interest Expended
8,620
8,688
9,405
9,673
10,243
10,508
10,519
0
12
Net Interest Income
6,102
6,418
6,875
7,620
7,737
8,057
8,545
6
24
Non Interest Income
3,851
3,156
3,883
3,621
3,425
4,194
4,574
9
18
Operating income
9,953
9,574
10,758
11,241
11,163
12,252
13,119
7
22
Operating Expenses
4,145
4,324
4,612
5,008
4,874
5,378
5,571
4
21
Employee expenses
1,514
1,661
1,734
1,899
1,953
2,141
1,942
(9)
12
Other Opex
2,631
2,663
2,878
3,109
2,921
3,236
3,629
12
26
Pre-prov. profit
5,808
5,250
6,146
6,233
6,288
6,874
7,549
10
23
Provisions & Contingencies
5,971
3,994
4,244
5,451
3,496
2,507
2,083
(17)
(51)
PBT
(164)
1,255
1,902
782
2,793
4,367
5,465
25
187
Provision for Taxes
(43)
347
297
(187)
885
3,712
1,319
(64)
344
Tax rate
26
28
16
(24)
32
85
24
(72)
54
PAT
(120)
909
1,605
969
1,908
655
4,146
533
158
Source: Company, Angel Research
Exhibit 2: Balance Sheet
Balance sheet
Q1FY19
Q2FY19
Q3FY19
Q4FY19
Q1FY20
Q2FY20
Q3FY20
% chg (qoq)
% chg (yoy)
Advance (` cr)
5,16,289
5,44,487
5,64,308
5,86,647
5,92,415
6,13,359
6,35,654
4
13
Deposit (` cr)
5,46,878
5,58,669
6,06,755
6,52,920
6,60,732
6,96,273
7,16,345
3
18
Credit-to-Deposit Ratio (%)
94
97
93
90
90
88
89
64.4bp
(426.9)bp
CA (` cr)
76,689
76,072
88,581
96,269
80,401
94,431
1,00,989
7
14
SA (` cr)
1,99,604
2,07,476
2,10,793
2,27,671
2,18,476
2,30,569
2,35,420
2
12
CASA deposits (` cr)
2,76,293
2,83,548
2,99,374
3,23,940
2,98,877
3,25,000
3,36,409
4
12
CASA %
50.5
50.8
49.3
49.6
45.2
46.7
47.0
28.5bp
(237.8)bp
Tier-I ratio
15.8
15.4
15.1
15.1
14.6
14.6
15.0
36bp
(16)bp
of which - CET1
14.4
14.0
13.7
13.6
13.2
13.2
13.6
38bp
(4)bp
Tier-II ratio
2.5
2.5
2.0
1.8
1.6
1.5
1.5
0bp
(49)bp
Total CAR ratio
18.4
17.8
17.2
16.9
16.2
16.1
16.5
36bp
(65)bp
Source: Company, Angel Research
3
ICICI Bank|Q3FY2020 Result Update
Jan 28, 2020
3
Exhibit 3: NIM Improved; Slippages remained elevated
Profitability Ratios (%)
Q1FY19
Q2FY19
Q3FY19
Q4FY19
Q1FY20
Q2FY20
Q3FY20
% chg (qoq)
% chg (yoy)
Rep. Yield on Advance
8.71
8.79
9.00
9.29
9.36
9.52
9.52
0bp
52bp
Rep. Cost of fund
4.99
5.00
5.14
5.20
5.23
5.19
5.06
(13)bp
(8)bp
Cost of Deposit
4.81
4.76
4.88
5.00
5.08
5.06
4.96
(10)bp
8bp
Reported NIM
3.19
3.33
3.22
3.72
3.61
3.64
3.77
13bp
55bp
Cost-to-income ratio
41.6
45.2
42.9
44.5
43.7
43.9
42.5
(143.1)bp
(40.5)bp
Asset quality
Gross NPAs (` cr)
53,465
54,489
51,627
46,328
45,799
45,695
43,454
(0)
(16)
Gross NPAs (%)
8.8
8.5
7.8
6.7
6.5
6.4
6.0
(42)bp
(180)bp
Net NPAs (` cr)
24,170
22,086
16,288
13,613
11,893
10,972
10,389
(8)
(50)
Net NPAs (%)
4.2
3.7
2.6
2.1
1.8
1.6
1.5
(11)bp
(109)bp
PCR (%)
52
57
67
69
73
75
75
7.6bp
824.8bp
Slippage ratio (%)
3.1
2.3
1.5
2.4
1.9
1.6
2.7
112.7bp
126.3bp
Credit Cost on Adv (Annl)
4.6
3.0
3.1
3.8
2.4
1.7
1.4
(26.3)bp
(166.2)bp
Source: Company, Angel Research
Exhibit 4: BB & Below Book increased
Particular
1QFY18
2QFY18
3QFY18
4QFY18
1QFY19
2QFY19
3QFY19
4QFY19
Q1FY20
Q2FY20
Q3FY20
GNPA
43,148
44,489
46,039
54,063
53,465
54,489
51,627
46,328
45,799
45,695
43,454
Outstanding stock of bad loans
28,300
28,300
25,800
13,461
11,898
10,720
3,690
3,299
3,280
3,280
2,087
(% of loans)
6.1%
5.9%
5.1%
2.6%
2.3%
2.0%
0.7%
0.6%
0.6%
0.5%
0.3%
Stressed asset
Sub investment grade
20,400
19,600
19,100
4,728
4,401
3,283
Security receipts
3,400
3,500
3,400
3,438
3,438
3,436
3,299
3,299
3,280
3,280
2,087
Other dispensation
4,500
5,200
3,300
5,295
4,059
4,001
391
Restructured loans
2,400
2,000
1,800
1,595
1,445
1,443
391
...5.25
200
200
200
-
2,004
2,005
SDR
1,500
2,700
1,000
-
-
S4A
400
300
300
2,200
610
553
Other
1,500
-
BB & Below
17,100
18,812
17,525
15,355
16,074
17,403
71,448
72,789
71,839
67,524
65,363
82,309
74,129
67,152
64,434
65,049
62,944
Stressed pool to loans (%)
15.4
15.1
14.2
13.2
12.7
15.1
13.1
11.4
10.9
10.6
9.9
Source: Company, Angel Research
4
ICICI Bank|Q3FY2020 Result Update
Jan 28, 2020
4
Outlook & Valuation: At the current market price, the bank’s core banking
business (after adjusting the value of subsidiaries) is trading at 2.1x FY2021E ABV.
Key parameter to watch for next few quarter slippages from corporate book and
addition to BB& Below book. We recommend a HOLD on the stock with a Target
Price of `590.
Exhibit 5: SOTP
Particular
%
Valuation Methodology
Value/share (`)
Value of ICICI standalone
100
2.3x FY21E ABV
440
2,80,233
Subsidiaries
ICICI Prudential Life
53
On Current M.Cap
61
39,475
General Insurance
56
On Current M.Cap
53
34,099
Mutual fund
51
10% of current AUM
29
18,459
Other (Home Fin, VC,
Securities PD and Overseas
subsidiaries)
38
24,206
Total subsidiaries' value @ 20% discount
145
92,991
Fair value per share
590
Source: Company, Angel Research
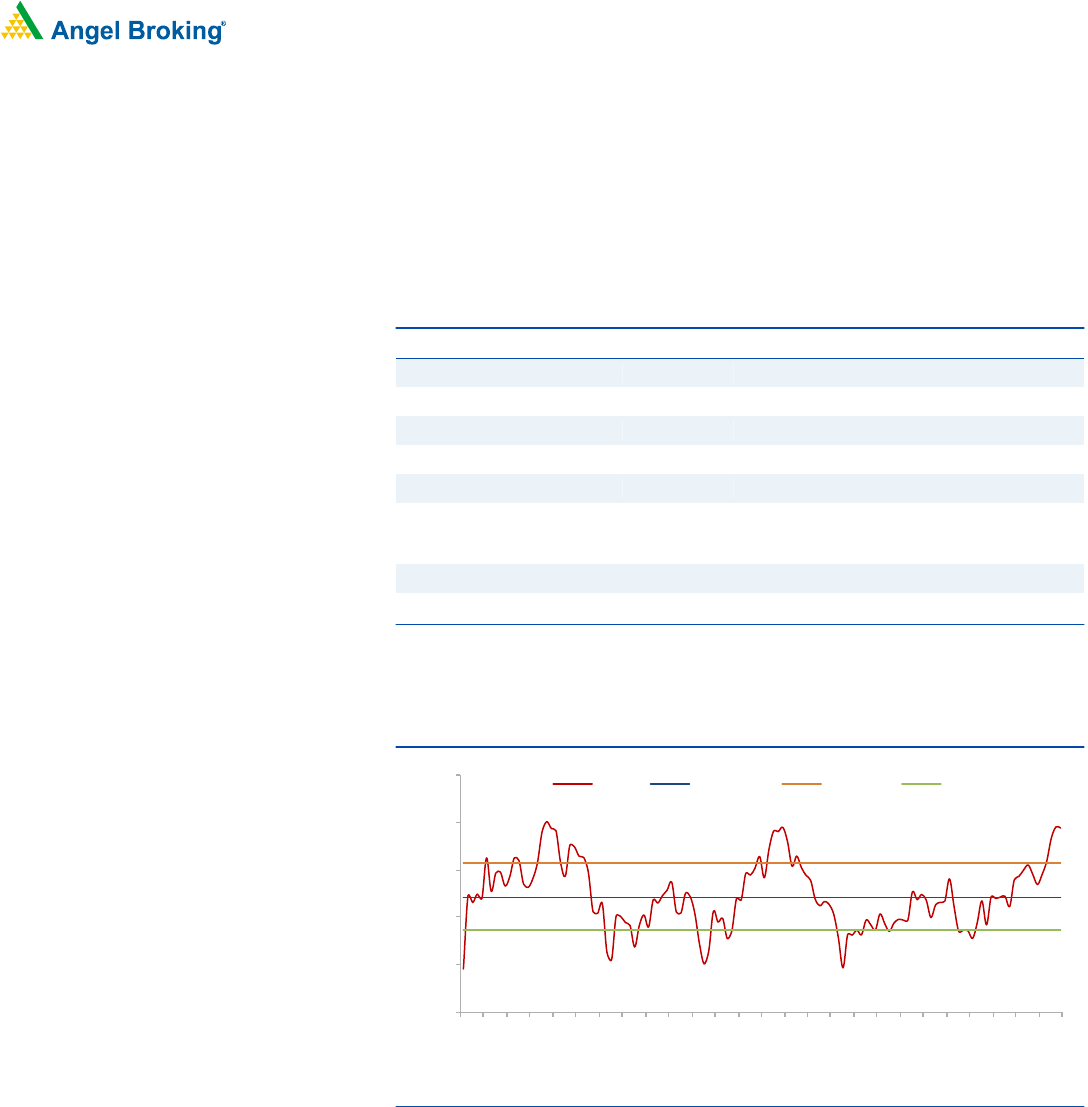
Exhibit 6: 1 Year Forward Adj P/B
Source: Company, Angel Research
2.94
1.46
2.94
2.22
1.87
1.00
1.50
2.00
2.50
3.00
3.50
Apr-09
Sep-09
Feb-10
Jul-10
Dec-10
May-11
Oct-11
Mar-12
Aug-12
Jan-13
Jun-13
Nov-13
Apr-14
Sep-14
Feb-15
Jul-15
Dec-15
May-16
Oct-16
Mar-17
Aug-17
Jan-18
Jun-18
Nov-18
Apr-19
Sep-19
P/BV
Avg. P/BV
+1STD
-1STD

5
ICICI Bank|Q3FY2020 Result Update
Jan 28, 2020
5
Income Statement
Y/E March (` cr)
FY18
FY19
FY20E
FY21E
FY22E
Net Interest Income
23,025
27,015
32,989
38,556
45,753
- YoY Growth (%)
6
17
22.1
16.9
18.7
Other Income
17,419
14,511
16,278
18,326
21,439
- YoY Growth (%)
(11)
-17
12
13
17
Operating Income
40,444
41,526
49,268
56,882
67,192
- YoY Growth (%)
(2)
3
19
15
18
Operating Expenses
15,704
18,089
21,194
23,568
27,294
- YoY Growth (%)
6
15
17
11
16
Pre - Provision Profit
24,741
23,437
28,074
33,314
39,897
- YoY Growth (%)
(7)
-5
20
19
20
Prov. & Cont.
17,307
19,661
11,003
10,022
10,719
- YoY Growth (%)
14
14
(44)
(9)
7
Profit Before Tax
7,434
3,776
17,070
23,292
29,178
- YoY Growth (%)
(34)
-49
352
36
25
Prov. for Taxation
789
413
7,027
5,823
7,295
- as a % of PBT
11
11
41
25
25
PAT
6,645
3,362
10,043
17,469
21,884
- YoY Growth (%)
(32)
(49.4)
199
74
25
Balance Sheet
Y/E March (` cr)
FY18
FY19
FY20E
FY21E
FY22E
Equity
1,292
1,294
1,298
1,298
1,298
Reserve & Surplus
1,03,868
1,07,074
1,16,371
1,30,346
1,47,852
Net worth
1,05,160
1,08,368
1,17,668
1,31,643
1,49,150
Deposits
5,60,975
6,52,920
7,41,417
8,50,793
9,76,305
- Growth (%)
14
16
14
15
15
Borrowings
1,82,859
1,65,320
1,41,977
1,66,093
1,94,305
Other Liab. & Prov.
30,195
37,851
78,662
1,07,740
1,42,031
Total Liabilities
8,79,189
9,64,459
10,79,724
12,56,269
14,61,791
Cash Balances
33,102
37,858
43,811
50,274
57,691
Bank Balances
51,067
42,438
33,529
38,475
44,151
Investments
2,02,994
2,07,733
2,37,365
2,74,878
3,18,348
Advances
5,12,395
5,86,647
6,61,080
7,73,371
9,04,734
- Growth (%)
10
14
13
17
17
Fixed Assets
7,904
7,931
11,371
13,048
14,973
Other Assets
71,727
81,852
92,568
1,06,224
1,21,894
Total Assets
8,79,189
9,64,459
10,79,724
12,56,269
14,61,791
- Growth (%)
14
10
12
16
16

6
ICICI Bank|Q3FY2020 Result Update
Jan 28, 2020
6
Key Ratio
Y/E March
FY18
FY19
FY20E
FY21E
FY22E
Profitability ratios (%)
NIMs
3.1
3.2
3.6
3.6
3.7
Cost to Income Ratio
39
44
43
41
41
RoA
0.8
0.4
1.0
1.5
1.6
RoE
6
3
9
14
16
B/S ratios (%)
CASA Ratio
52
50
47
49
49
Credit/Deposit Ratio
0.91
0.90
0.89
0.91
0.93
Asset Quality (%)
Slippages
6.4
2.5
2.0
1.5
1.5
Loan Loss Prov. /Avg. Assets
2.10
2.13
1.08
0.86
0.79
Provision Coverage
48
71
70
70
70
Per Share Data (`)
EPS
10
5
16
27
34
ABVPS (70% cover.)
129
153
167
189
216
DPS
2
1
3
5
7
Valuation Ratios
PER (x)
52
103
34
20
16
P/ABVPS (x)
4.2
3.5
3.2
2.8
2.5
Dividend Yield (%)
0.4
0.2
0.6
1.0
1.3
DuPont Analysis
NII
2.8
2.9
3.2
3.3
3.4
(-) Prov. Exp.
2.1
2.1
1.1
0.9
0.8
Adj. NII
0.7
0.8
2.2
2.4
2.6
Other Inc.
2.1
1.6
1.6
1.6
1.6
Op. Inc.
2.8
2.4
3.7
4.0
4.2
Opex
1.9
2.0
2.1
2.0
2.0
PBT
0.9
0.4
1.7
2.0
2.1
Taxes
0.1
0.0
0.7
0.5
0.5
RoA
0.8
0.4
1.0
1.5
1.6
Leverage
8.0
8.6
9.0
9.4
9.7
RoE
6.5
3.1
8.9
14.0
15.6
Valuation done on closing price of 27/01/2020

7
ICICI Bank|Q3FY2020 Result Update
Jan 28, 2020
7
Disclosure of Interest Statement ICICI Bank
1. Financial interest of research analyst or Angel or his Associate or his relative No
2. Ownership of 1% or more of the stock by research analyst or Angel or associates or relatives No
3. Served as an officer, director or employee of the company covered under Research No
4. Broking relationship with company covered under Research No
Research Team Tel: 022 - 39357800 E-mail: rese[email protected] Website: www.angelbroking.com
Angel Broking Limited (hereinafter referred to as “Angel”) is a registered Member of National Stock Exchange of India Limited, Bombay
Stock Exchange Limited, Metropolitan Stock Exchange Limited, Multi Commodity Exchange of India Ltd and National Commodity &
Derivatives Exchange Ltd It is also registered as a Depository Participant with CDSL and Portfolio Manager and Investment Adviser with
SEBI. It also has registration with AMFI as a Mutual Fund Distributor. Angel Broking Limited is a registered entity with SEBI for Research
Analyst in terms of SEBI (Research Analyst) Regulations, 2014 vide registration number INH000000164. Angel or its associates has not
been debarred/ suspended by SEBI or any other regulatory authority for accessing /dealing in securities Market. Angel or its
associates/analyst has not received any compensation / managed or co-managed public offering of securities of the company covered
by Analyst during the past twelve months.
This document is solely for the personal information of the recipient, and must not be singularly used as the basis of any investment
decision. Nothing in this document should be construed as investment or financial advice. Each recipient of this document should
make such investigations as they deem necessary to arrive at an independent evaluation of an investment in the securities of the
companies referred to in this document (including the merits and risks involved), and should consult their own advisors to determine
the merits and risks of such an investment.
Reports based on technical and derivative analysis center on studying charts of a stock's price movement, outstanding positions and
trading volume, as opposed to focusing on a company's fundamentals and, as such, may not match with a report on a company's
fundamentals. Investors are advised to refer the Fundamental and Technical Research Reports available on our website to evaluate the
contrary view, if any
The information in this document has been printed on the basis of publicly available information, internal data and other reliable
sources believed to be true, but we do not represent that it is accurate or complete and it should not be relied on as such, as this
document is for general guidance only. Angel Broking Limited or any of its affiliates/ group companies shall not be in any way
responsible for any loss or damage that may arise to any person from any inadvertent error in the information contained in this report.
Angel Broking Limited has not independently verified all the information contained within this document. Accordingly, we cannot testify,
nor make any representation or warranty, express or implied, to the accuracy, contents or data contained within this document. While
Angel Broking Limited endeavors to update on a reasonable basis the information discussed in this material, there may be regulatory,
compliance, or other reasons that prevent us from doing so.
This document is being supplied to you solely for your information, and its contents, information or data may not be reproduced,
redistributed or passed on, directly or indirectly.
Neither Angel Broking Limited, nor its directors, employees or affiliates shall be liable for any loss or damage that may arise from or in
connection with the use of this information.
Ratings (Based on Expected Returns: Buy (> 15%) Accumulate (5% to 15%) Neutral (-5 to 5%)
over 12 months investment period) Reduce (-5% to -15%) Sell (< -15%)
Hold (Fresh purchase not recommended)
Note: We have not considered any Exposure below
`
1 lakh for Angel, its Group companies and Directors